Within each Project are multiple finance graphs and charts. These help detail where the finances and resources are being spent.
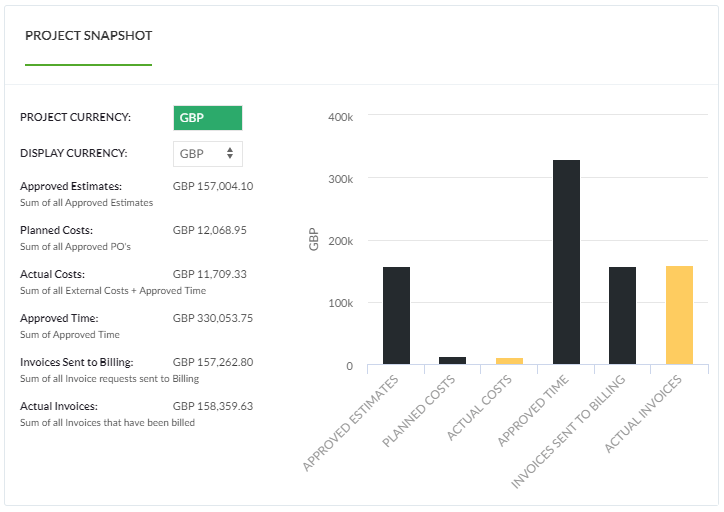
Project Snapshot
This will give you a quick overview of your project and let you know where your finances are. The graph will detail the total of all your approved estimates, PO’s, Invoice requests, as well as your actuals, such as actual costs and actual invoices.
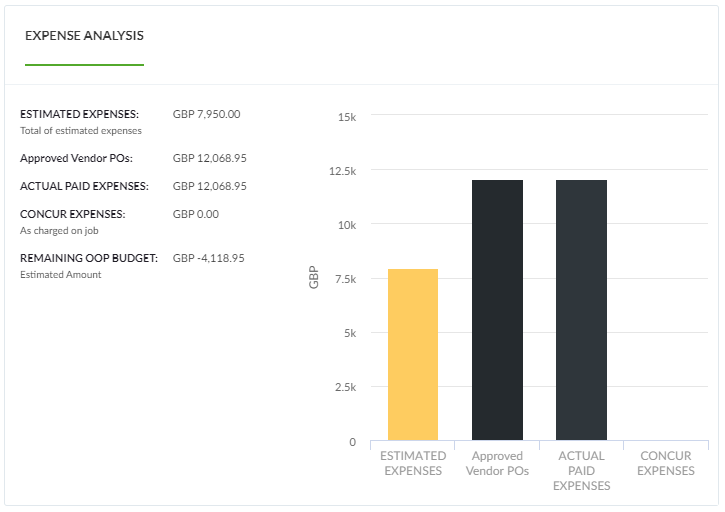
Expense Analysis
The will detail all the estimated expenses on the project as well as the approved PO’s against actual paid expenses.
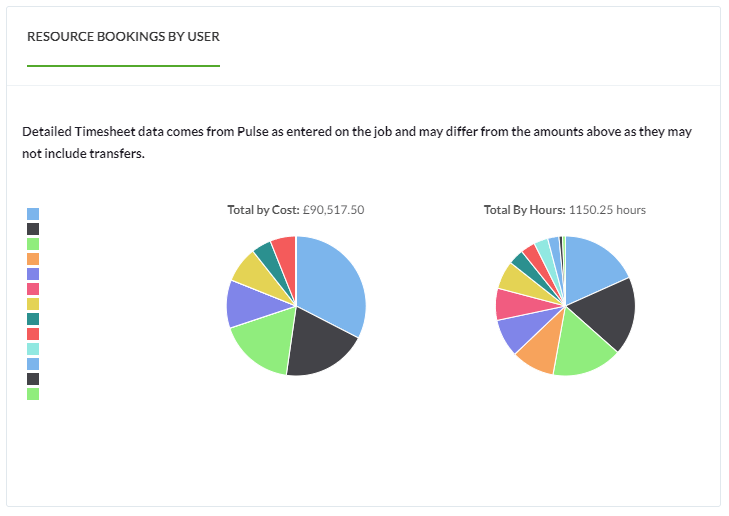
Resource Bookings by User
This pie chart details how many future resources have been booked on your project. This is split by cost as well as in hours.
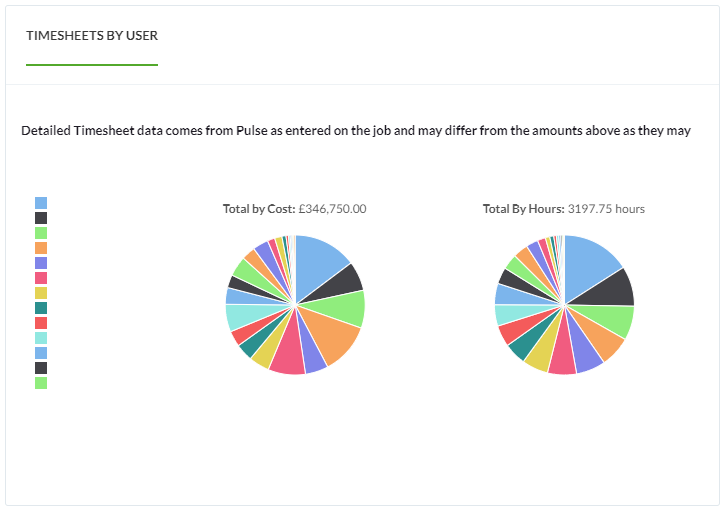
Timesheets by User
This pie chart details how many timesheets have been booked on your project. This is split by cost as well as in hours.
Budget Estimate Trackers
This table will show your burn rate for all the roles/departments/activities that you estimated against your actuals from the timesheets.
You have now completed this training module.
We hope this new knowledge helps you with getting the most out of Pulse.
Feel free to browse our other Training Modules to learn more about our specific features or how to use Pulse in specific User Roles .
Pulse for Beginners
If you are just starting with Pulse
Pulse Feature Training
Training Modules for each of the main Pulse Features.