We are happy to announce a major upgrade to the Pulse Gantt Chart technology.
The new features make it quicker and easier to manage your Project Tasks and Timings with the interactive Gantt bars.
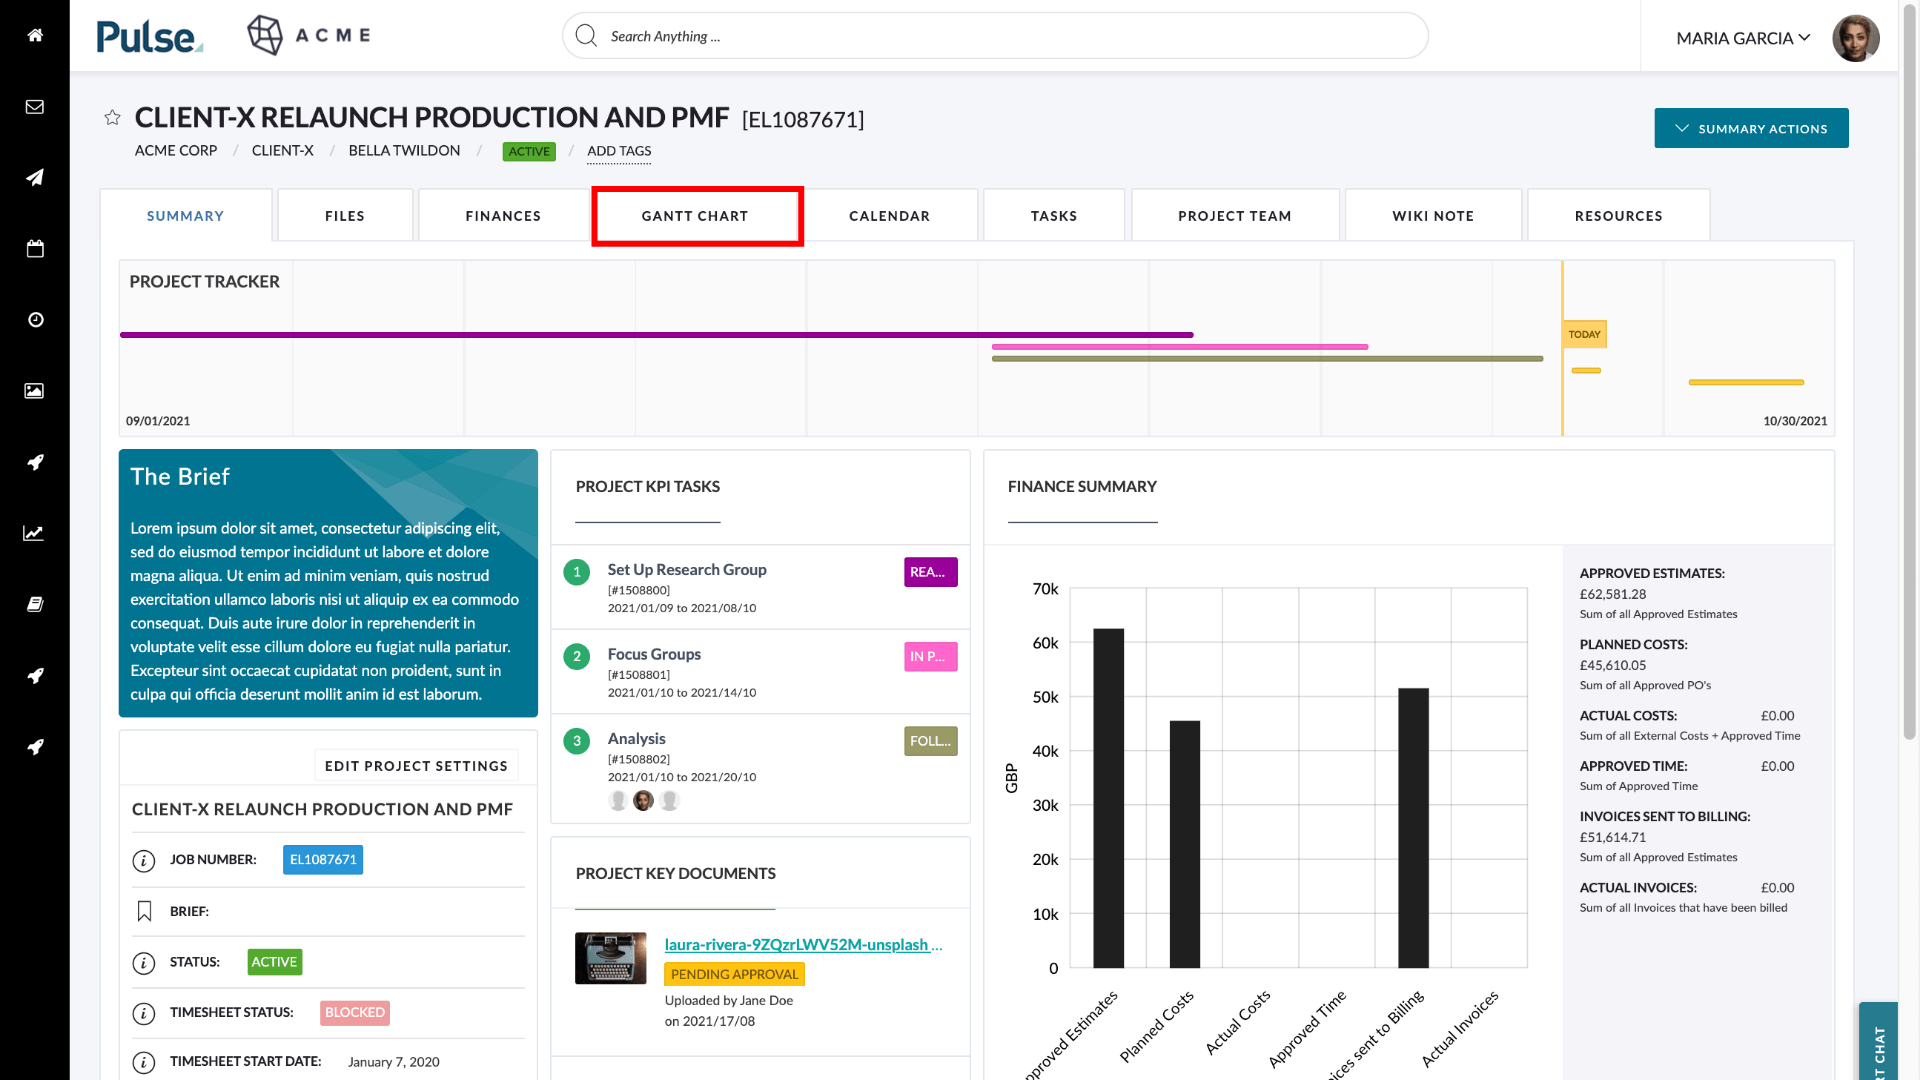
The Gantt chart view of a project allows the scheduling of activities, deliverables, and milestones within a project.
The Pulse Gantt interface has been completely re-worked, with a highly configurable and flexible grid view, and complete integration with other Pulse tools.
How to Access the Upgraded Gantt Chart
If you were using the old Gantt chart your projects will already be upgraded to use the new version.
If you do not have a Gantt chart tab you need to enable the Gantt tab in Project Settings > Advanced.
What is new in the Upgraded Gantt Chart
The newly upgraded Gantt Chart has the following new features
- Bulk Edit
- Export to PDF
- Schedule Lag and Constraints
- Filters
Bulk Edit
You can Bulk Edit Tasks by dragging their parent task. All the dates on the child tasks will automatically be updated. All existing dependencies between tasks will also cascade.
You can also copy and paste a selection of tasks, indent/outdent a selection of tasks or covert them to milestones with the click of a button.
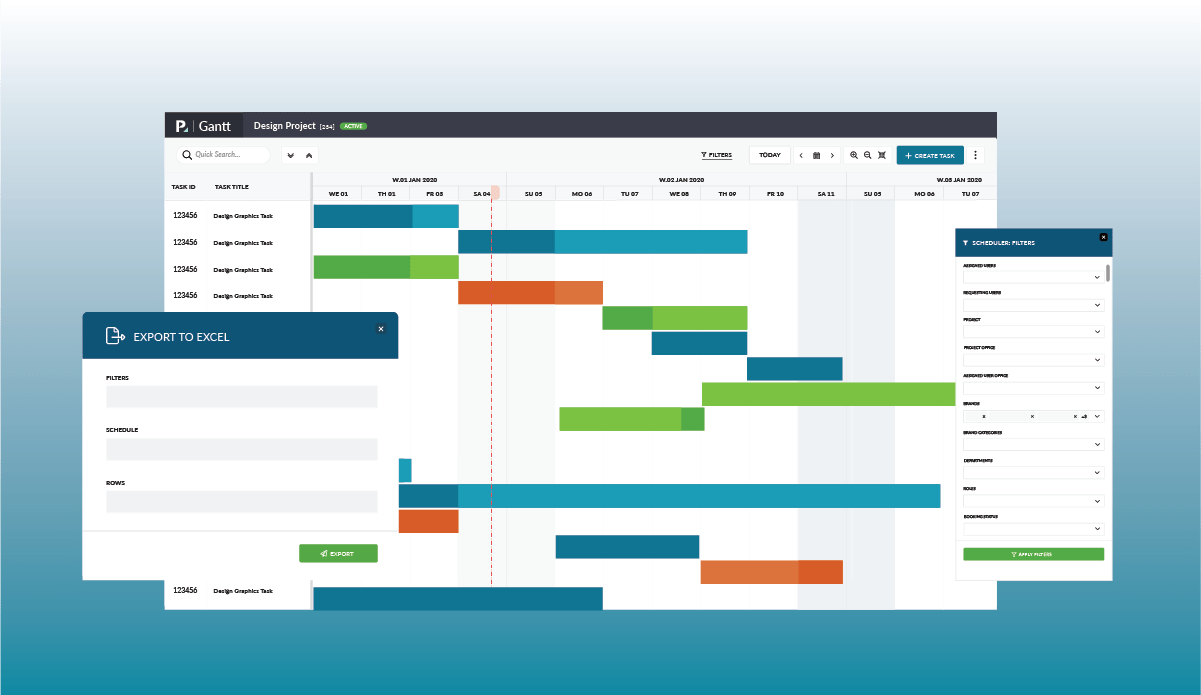
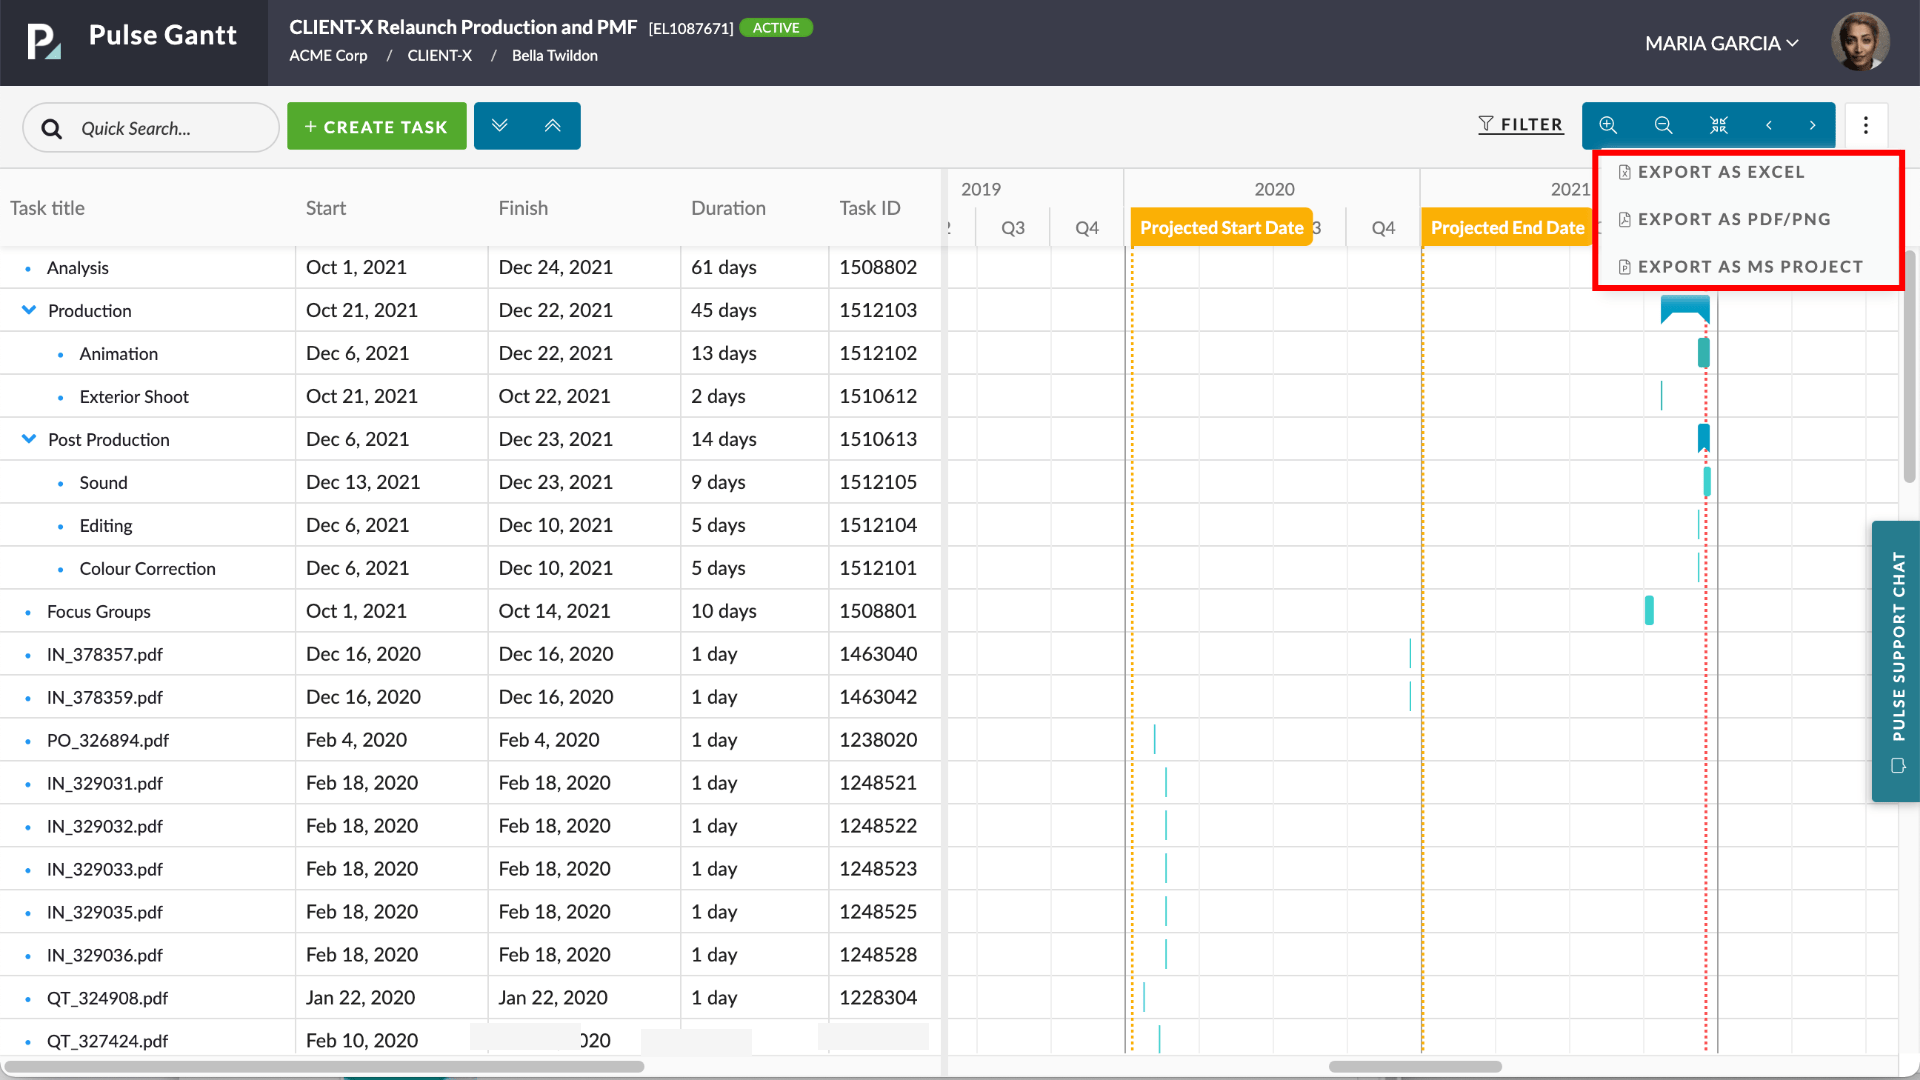
Export
You can export project schedules as Microsoft Excel, PNG/PDF, or as a Microsoft Project file. Click on the 3 vertical dots on the right corner of the Gantt chart screen to select your export format.
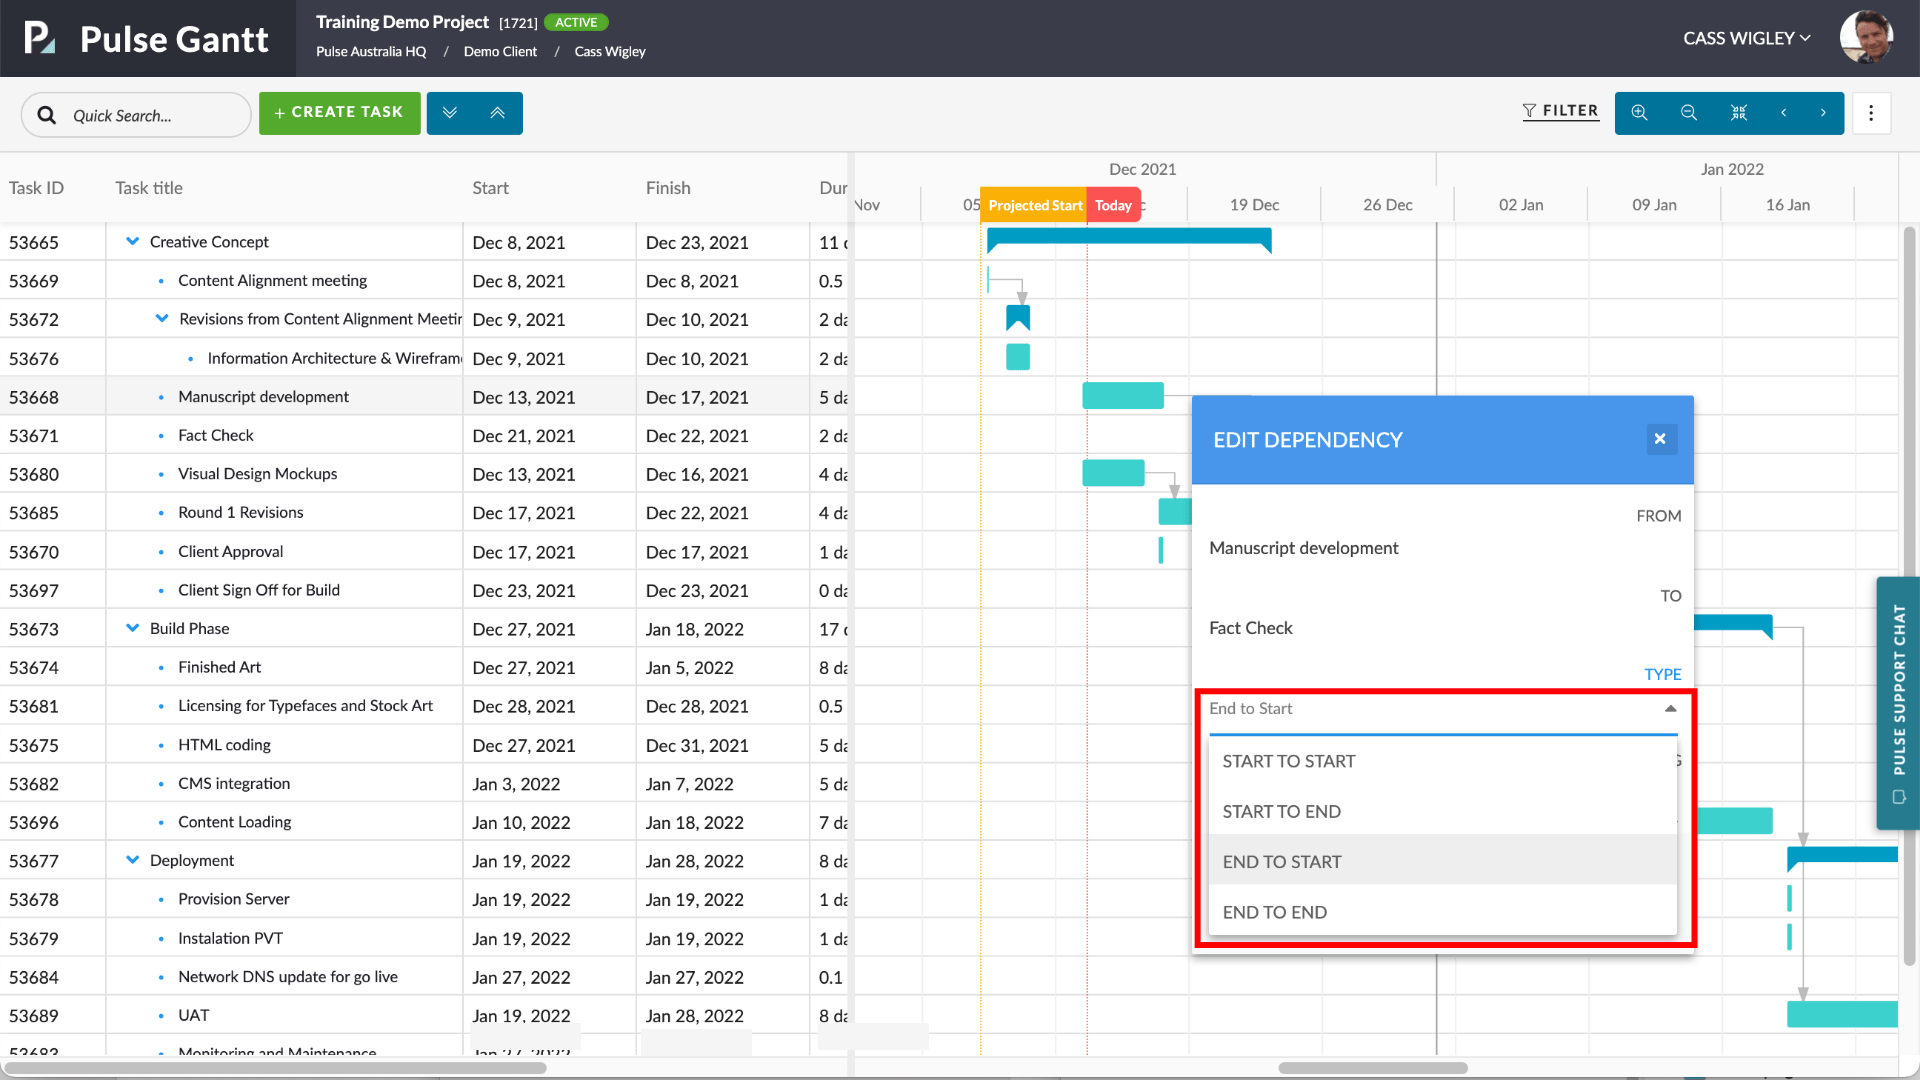
Schedule Lag and Constraints
The upgraded Gantt chart allows you to encode sophisticated logic into your schedule such as “Lag” and “Constraints.”
Project schedules rely on dependencies to determine the order of a project timeline. Predecessors, in project management, are activities that must begin or end before a successor task can proceed. Lag is the amount of wait time between two tasks. In other words, lag is the amount of time by which a successor activity will be delayed. Lag can be used in all the four logical relationships in scheduling: End-to-start (ES), Start-to-start (SS), End-to-end (EE) and Start-to-end (SE). A schedule constraint is a limitation placed on a project schedule that affects the start or end date of an activity. Now, in any task, you will see:
- Advanced Options > Constraint Settings
- Scheduling > Dependencies and Lag Settings
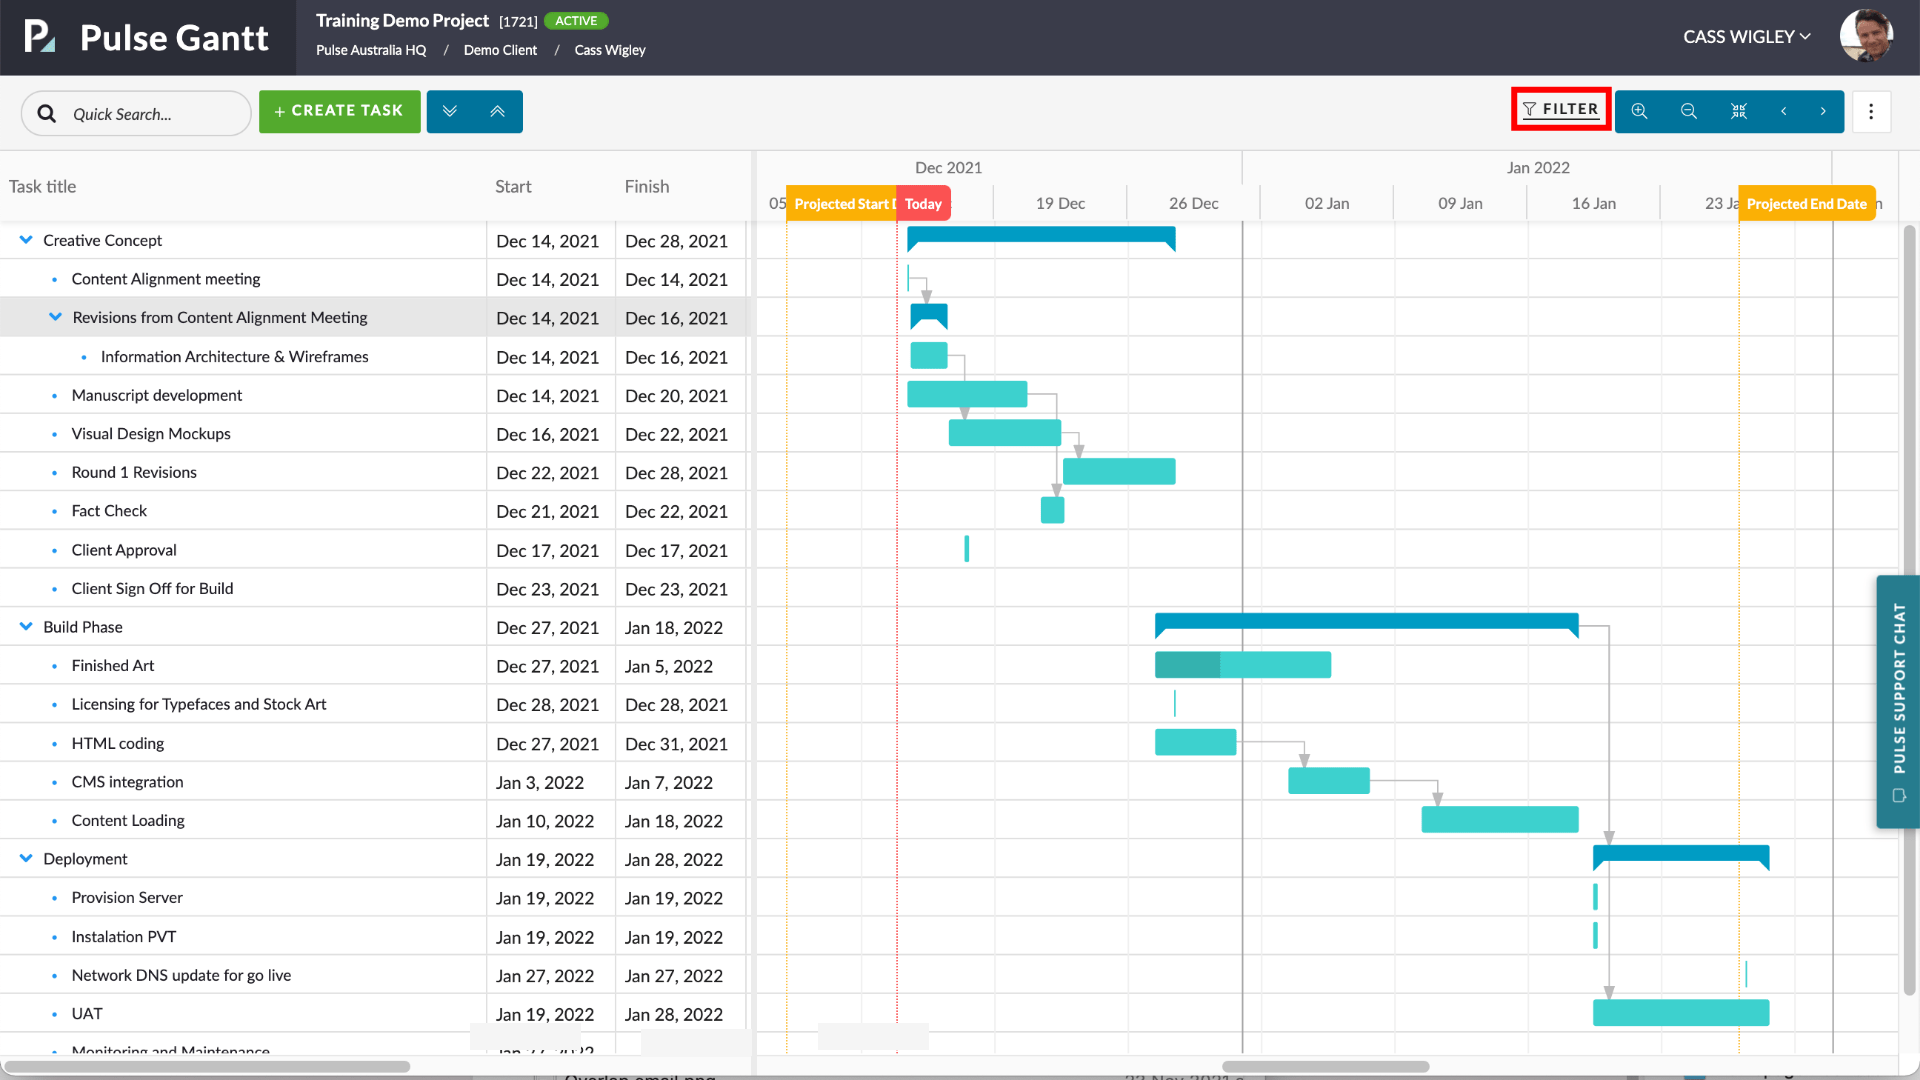
Filters
You can filter the contents of the Gantt chart. You can use filters to:
- remove completed or cancel tasks from the view, or
- show a schedule for a particular user
To access the filters panel, click the “FILTERS” button.
This will launch the “GANTT: FILTERS” flyover panel.
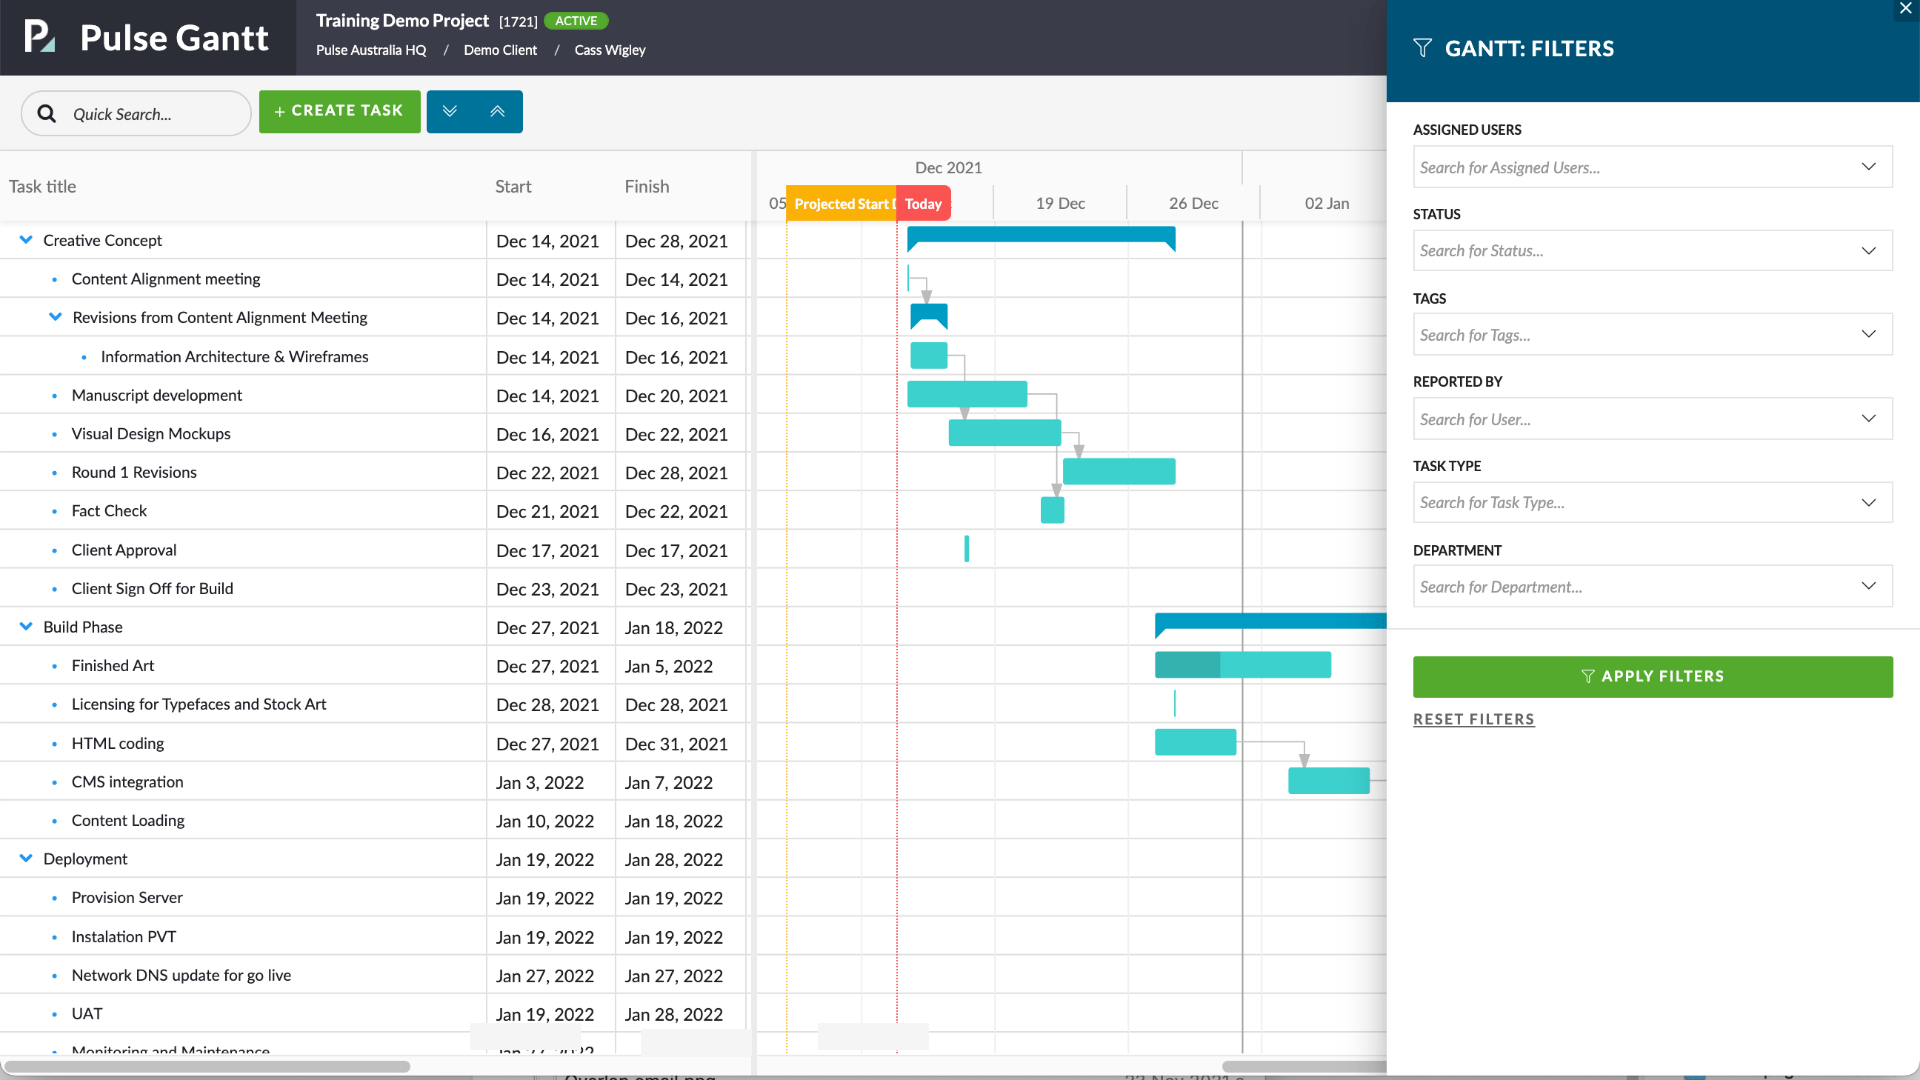
The filters flyover lets you filter by:
- Assigned Users
- Task Status
- Tags
- User who reported the task
- Task Type