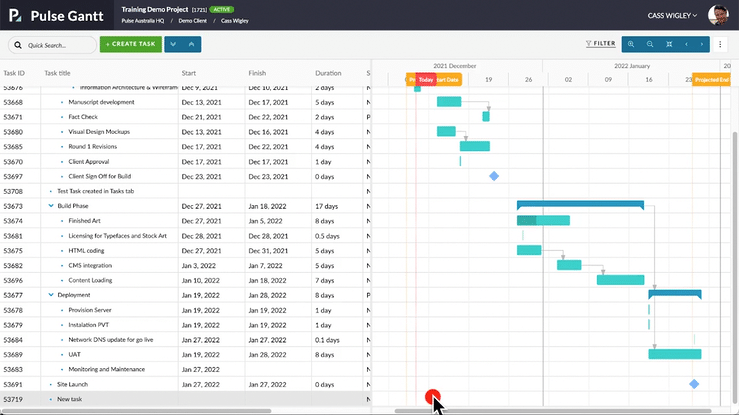
Pulse includes a powerful interactive Gantt Chart, to help you plan your Project Schedule using Tasks.
What is a Gantt Chart?
- A Gantt Chart is a way of representing significant events in a Project over time as a column range bar chart.
- It is named after its popularizer, Henry Gantt, who designed such a chart in the early 1900s.
- Using Pulse Projects, important Activities, Deliverables and Events are represented as Tasks.
- In the the Pulse Gantt Chart, you can easily edit the Task Start Dates, End Dates and Duration to manage the Project Schedule.
- Using the Advanced Gantt Chart features, you can also define advanced Schedule Time Controls such as Task Predecessors, Successors, Lag and Constraints.
In this Gantt Chart Training module, you will learn about: